Browsing Memory the JRuby Way
Share on:
There's been a lot of fuss made lately over memory inspection and profiling tools for Ruby implementations. And it's not without reason; inspecting a Ruby application's memory profile, much less diagnosing problems, has traditionally been very difficult. At least, difficult if you don't use JRuby.
So we have our test subject ready to go. To use the jmap tool, we need the pid of this process. Of course we can use the usual shell tricks to get it, but the JDK comes with a nice tool for finding all JVM pids active on the system: jps
From this, you can see I have three JVMs running on my system right now: jps itself; our JRuby instance; and a GlassFish server I used for testing earlier today. We're interested in the JRuby instance, pid 52857. Let's see what jmap can do with that.
The simplest option here is -histo, to print out a histogram of the objects on the heap. Let's run that against our JRuby instance.
The resulting output is a listing of literally every object in the system...not just Ruby objects even! The value of this should be apparent; not only can you start to investigate the memory overhead of code you've written, you'll also be able to investigate the memory overhead of every library and every piece of code running in the same process, right down to byte arrays (the "[B" above) and "native" Java strings ("java.lang.String" above). And so far we haven't had to do anything special to JRuby. Nice, eh?
So, back to the matter at hand: the Foo class from our example. Where is it?
Well, the answer is that it's right there; 10000 of those 10002 org.jruby.RubyObject instances are our Foo objects; the other two are probably objects constructed for JRuby runtime purposes. But obviously, there's nothing in this output that tells us how to find our Foo instances. This is what I'm remedying in JRuby 1.6.
On JRuby master, there's now a flag you can pass that will stand up a JVM class for every user-created Ruby class. Among the many benefits of doing this, we also get a more useful profile. Let's see how to use the flag (which will either be default or very easy to access by the time we release JRuby 1.6).
If we run jmap against this new instance, we see a more interesting result.
A-ha! There's our Foo instances! The "reify classes" option generates a JVM class of the same name as the Ruby class, prefixed by "ruby." to separate it from other JVM classes. Now we can start to see the real power of the tools, and we're just at the beginning. Let's see what a simple Rails application looks like.
This time I've opted to grep out just the "ruby." items in the histogram, and the results are pretty impressive! We can see the baffling fact that there's 970 instance of Gem::Version, using at least 23280 bytes of memory. We can see the even more depressing fact that there's 11685 live instances of TZInfo::TimezoneTransitionInfo, using at least 280440 bytes.
Now that we're getting useful data, let's look at the first of our tools in more detail: jmap and jhat.
jmap and jhat
As you might guess, I do a lot of profiling in the process of developing JRuby. I've used probably a dozen different tools at different times. But the first tool I always reach for is the jmap/jhat combination.
You've seen the simple case of using jmap above, generating a histogram of the live heap. Let's take a look at an offline heap dump.
That's how easy it is! The binary dump in heap.bin is supported by several tools: jhat (obviously), VisualVM, the Eclipse Memory Analysis Tool, and others. It's not officially a "standard" format, but it hasn't changed in a long time. Let's have a look at jhat options.
Generally you can just point jhat at a heap dump and away it goes. Occasionally if the heap is large, you may need to use the -J option to increase the maximum heap size of the JVM jhat runs in. Since we're running a Rails app, we'll bump the heap up a little bit.
"Server is ready"? Damn you Java people! Does everything have to be a server with you?
In this case, it's actually an incredibly useful tool. jhat starts up a small web application on port 7000 that allows you to click through the dump file. Let's see what that looks like.
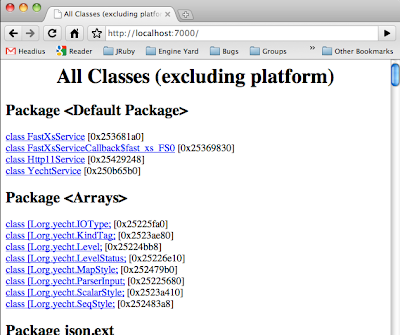
Here's the front page of the tool. We see a listing of all JVM classes in the system. If you scroll to the bottom, there's a few more general functions.
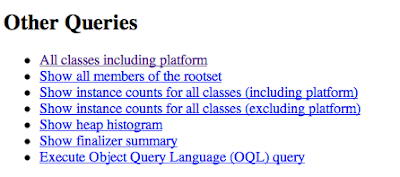
Let's go with what we know and view the heap histogram again.
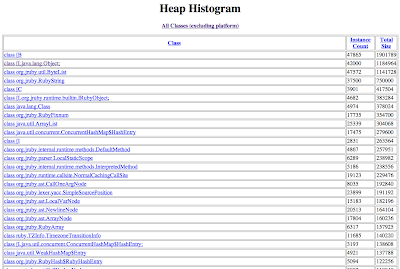
Here we can see that there's lots of objects taking up memory, and they're a mix of JVM-native types, JRuby implementation classes, and actual Ruby classes. In fact, here we can see our friend TZInfo::TimezoneTransitionInfo again. Let's click through.

Pretty mundane stuff so far; basically just information about the class itself. But you see at the bottom of this screenshot that we can go from here to viewing all instances of TimezoneTransitionInfo. Let's try that.
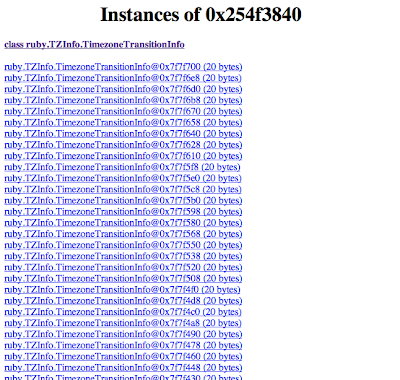
Ahh, that's more like it! Now we can see that there's a heck of a lot of these things floating around. Let's investigate a bit more and click through the first instance.

Now this is some cool stuff!
We can see that the JVM class generated for TimezoneTransitionInfo has three fields: metaClass, which points at the Ruby Class object; varTable, which is an array of Object references used for instance variables and other "internal" variables; and a flags field containing runtime flags for the object, like whether it's frozen, tainted, and so on. We can see that this object has no special flags set, and we can dig deeper into those fields if we like. We'll skip that today.
Moving further down, we see a few more amazing links. First, there's a list of all references to this object. Ahh, now we can start to investigate why they're staying in memory, even though we're not using them. We can even have jhat show us the full chains of references keeping these objects alive; a series of objects leading all the way back to one "rooted" by a thread or by global JVM state. And we can explore the other direction as well, walking all objects reachable from this one.
This is only a small part of what you can do with jmap and jhat, and they're so simple to use it feels almost criminal. But what if we want to inspect an application while it's running? Dumping heaps and analyzing them offline can tell you much of the story, but sometimes you just want to see the objects coming and going yourself. Let's move on to VisualVM.
VisualVM
VisualVM spawned out of the NetBeans profiling tools. One of the biggest complaints about the JVMs of old were that all the built-in tooling seemed to be designed for JVM engineers alone. Because Sun had the foresight to build and own their own IDE and related modules, it eventually became a natural fit to pull out the profiling tools for use by everyone. And so VisualVM was born.
On most systems with Java 6 installed, you should have a "jvisualvm" command. Let's run it now.
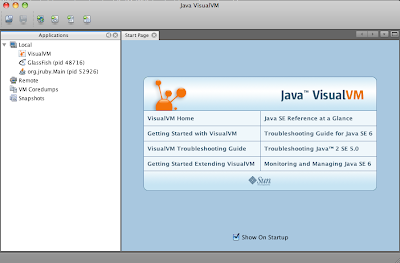
When you start up VisualVM, you're presented with a list of running JVMs, similar to using the 'jps' command. You can also connect to remote machines, browse offline heap and core dump files, and look through memory and CPU profiling snapshots from previous runs. Today, we'll just open up our running Rails app and see what we can see.
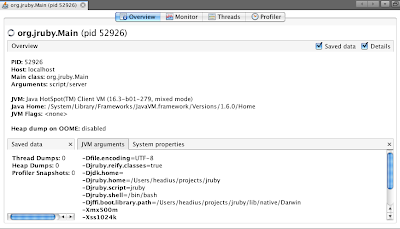
VisualVM connects to the running process and brings up a basic information pane with process information, JVM information, and so on. We're interested in monitoring heap usage, so let's move to the "Monitor" tab.
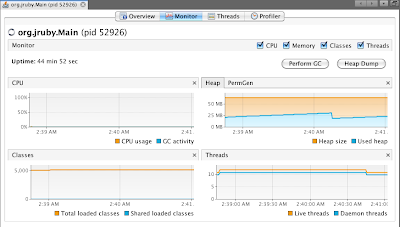
Already we're getting some useful information. This view shows CPU usage (currently zero, since it's an idle Rails app), Heap usage over time, and the number of JVM classes and threads that are active. We can trigger a full GC, if we'd like to tidy things up before we start poking around. But most importantly, we can do the jmap/jhat dance in one step, by clicking the Heap Dump button. Tantalizing, isn't it?
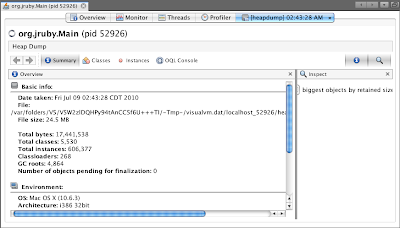
Initially, we see a basic summary of the heap: total size, number of classes and GC roots, and so on. We're looking for our friend TimezoneTransitionInfo, so let's look for it in the "Classes" pane.

Ahh, there it is, just a little ways down the list. The counts are as we expect, so let's double-click and dig a bit deeper.
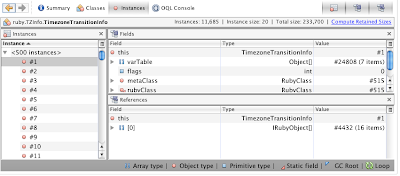
Here we have a lot of the same information about object instances that we did with jhat, but presented in a much richer format. Almost everything is active; you can jump around the heap and do analysis that would take a lot of manual work very easily. Let's try another tool: the Retained Size calculator.
Because our JVM tools see all objects equally, the reported size for a Ruby object on the heap is only part of the story. There's also the variable table, the object's instance variables, and objects they reference to consider. Let's jump to a different object now, Gem::Version.
We don't want to have to scroll through the list of classes to find ruby.Gem.Version, so let's make use of the Object Query Language console. With the OQL console, you can write SQL-like queries to retrieve listings of objects in the heap. We'll search for all instances of ruby.Gem.Version.

The query runs and we get a listing of Gem::Version objects. Let's dig deeper and see how much retained memory each Version object is keeping alive.
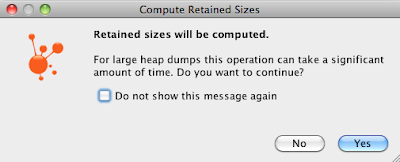
Clicking on the "Compute Retained Sizes" link in the "Instances" pane prompts us with this dialog. We're tough...we can take it.

Reticulating splines...
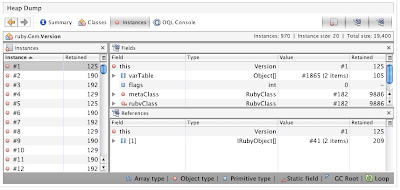
So it looks like each of the Version objects take from 125 to 190 bytes for a total of 19400 bytes, most of which is from the variable table. What's in there?

Ahh...looks like there's a String and an Array. And of course we can poke around the heap ad infinatum, into and out of "native" JRuby and JVM classes, and truly get a complete picture of what our running applications look like. Now you're playing with power.
Your Turn
This is obviously only the tip of the iceberg. Tools like Eclipse Memory Analysis Tool include features for detecting leaks; VisualVM and NetBeans both allow you to turn on allocation tracing, to show where in your code all those objects are being created. There's tools for monitoring live GC behavior, and many of these tools even allow you to dig into a running heap and modify live objects. If you can dream it, there's a tool that can do it. And you get all that for free by using JRuby.
If you'd like to play with this, it all works with JRuby 1.5.1 but you won't get the nice JVM classes for Ruby classes. For that, you can pull and build JRuby master, download a 1.6.0.dev snapshot, or just wait for JRuby 1.6. And if you do play with these or other tools, I hope you'll let us know and blog about your experience!
In the future, I'll try to show some of the other tools plus some of the CPU profiling capabilities they bring to the table. For now, rest assured that if you're using JRuby, you really do have the best tools available to you.
Because JRuby runs on the JVM, we benefit from the dozens of tools that have been written for the JVM. Among these tools are numerous memory inspection, profiling, and reporting tools, some built into the JDK itself. Want a heap dump? Check out the jmap (Java memory map) and jhat (Java heap analysis tool) shipped with Hotspot-based JVMs (Sun, OpenJDK). Looking for a bit more? There's the Memory Analysis Tool based on Eclipse, the YourKit memory and CPU profiling app, VisualVM, now also shipped with Hotspot JVMs...and many more. There's literally dozens of these tools, and they provide just about everything you can imagine for investigating memory.
In this post, I'll show how you can use two of these tools: VisualVM, a simple, graphical tool for exploring a running JVM; and the jmap/jhat combination, which allows you to dump the memory heap to disk for inspection offline.
Getting JRuby Prepared
All these tools work with any version of JRuby, but as part of JRuby 1.6 development I've been adding some enhancements. Specifically, I've made some modifications that allow Ruby objects to show up side-by-side with Java objects in memory profiles. A little explanation is in order.
In JRuby, all the core classes are represented by "native" Java classes. Object is represented by org.jruby.RubyObject, String is org.jruby.RubyString, and so on. Normally, if you extend one of the core classes, we don't actually create a new "native" class to represent it; instead, all user-created classes that extend Object simply show up as RubyObject in memory. This is still incredibly useful; you can look into RubyObject and see the metaClass field, which indicates the actual Ruby type.
Let's see what that looks like, so we know where we're starting from. We'll run a simple script that creates a custom class, instantiates and saves 10000 instances of it, and then sleeps.
~/projects/jruby ➔ cat foo_heap_example.rb
class Foo
end

ary = []
10000.times { ary << Foo.new }

puts "ready for analysis!"
sleep

~/projects/jruby ➔ jruby foo_heap_example.rb
ready for analysis!
So we have our test subject ready to go. To use the jmap tool, we need the pid of this process. Of course we can use the usual shell tricks to get it, but the JDK comes with a nice tool for finding all JVM pids active on the system: jps
~/projects/jruby ➔ jps -l
52862 sun.tools.jps.Jps
52857 org/jruby/Main
48716 com.sun.enterprise.glassfish.bootstrap.ASMain
From this, you can see I have three JVMs running on my system right now: jps itself; our JRuby instance; and a GlassFish server I used for testing earlier today. We're interested in the JRuby instance, pid 52857. Let's see what jmap can do with that.
~/projects/jruby ➔ jmap
Usage:
    jmap [option] <pid>
        (to connect to running process)
    jmap [option] <executable <core>
        (to connect to a core file)
    jmap [option] [server_id@]<remote server IP or hostname>
        (to connect to remote debug server)

where <option> is one of:
    <none>               to print same info as Solaris pmap
    -heap                to print java heap summary
    -histo[:live]        to print histogram of java object heap; if the "live"
                         suboption is specified, only count live objects
    -permstat            to print permanent generation statistics
    -finalizerinfo       to print information on objects awaiting finalization
    -dump:<dump-options> to dump java heap in hprof binary format
                         dump-options:
                           live         dump only live objects; if not specified,
                                        all objects in the heap are dumped.
                           format=b     binary format
                           file=<file>  dump heap to <file>
                         Example: jmap -dump:live,format=b,file=heap.bin <pid>
    -F                   force. Use with -dump:<dump-options> <pid> or -histo
                         to force a heap dump or histogram when <pid> does not
                         respond. The "live" suboption is not supported
                         in this mode.
    -h | -help           to print this help message
    -J<flag>             to pass <flag> directly to the runtime system

<
The simplest option here is -histo, to print out a histogram of the objects on the heap. Let's run that against our JRuby instance.
~/projects/jruby ➔ jmap -histo:live 52857

 num     #instances         #bytes  class name
----------------------------------------------
   1:         22677        3192816  <constMethodKlass>
   2:         22677        1816952  <methodKlass>
   3:         35089        1492992  <symbolKlass>
   4:          2860        1389352  <instanceKlassKlass>
   5:          2860        1193536  <constantPoolKlass>
   6:          2798         739264  <constantPoolCacheKlass>
   7:          5861         465408  [B
   8:          5399         298120  [C
   9:          3042         292032  java.lang.Class
  10:          4037         261712  [S
  11:         10002         240048  org.jruby.RubyObject
  12:          3994         179928  [[I
  13:          5474         131376  java.lang.String
  14:          1661          95912  [I
...
The resulting output is a listing of literally every object in the system...not just Ruby objects even! The value of this should be apparent; not only can you start to investigate the memory overhead of code you've written, you'll also be able to investigate the memory overhead of every library and every piece of code running in the same process, right down to byte arrays (the "[B" above) and "native" Java strings ("java.lang.String" above). And so far we haven't had to do anything special to JRuby. Nice, eh?
So, back to the matter at hand: the Foo class from our example. Where is it?
Well, the answer is that it's right there; 10000 of those 10002 org.jruby.RubyObject instances are our Foo objects; the other two are probably objects constructed for JRuby runtime purposes. But obviously, there's nothing in this output that tells us how to find our Foo instances. This is what I'm remedying in JRuby 1.6.
On JRuby master, there's now a flag you can pass that will stand up a JVM class for every user-created Ruby class. Among the many benefits of doing this, we also get a more useful profile. Let's see how to use the flag (which will either be default or very easy to access by the time we release JRuby 1.6).
~/projects/jruby ➔ jruby -J-Djruby.reify.classes=true foo_heap_example.rb
ready for analysis!
If we run jmap against this new instance, we see a more interesting result.
 num     #instances         #bytes  class name
----------------------------------------------
   1:         22677        3192816  <constMethodKlass>
   2:         22677        1816952  <methodKlass>
   3:         35089        1492992  <symbolKlass>
   4:          2860        1389352  <instanceKlassKlass>
   5:          2860        1193536  <constantPoolKlass>
   6:          2798         739264  <constantPoolCacheKlass>
   7:          5863         465456  [B
   8:          5401         298208  [C
   9:          3042         292032  java.lang.Class
  10:          4037         261712  [S
  11:         10000         240000  ruby.Foo
  12:          3994         179928  [[I
  13:          5476         131424  java.lang.String
  14:          1661          95912  [I
A-ha! There's our Foo instances! The "reify classes" option generates a JVM class of the same name as the Ruby class, prefixed by "ruby." to separate it from other JVM classes. Now we can start to see the real power of the tools, and we're just at the beginning. Let's see what a simple Rails application looks like.
~/projects/jruby ➔ jmap -histo:live 52926 | grep " ruby."
  29:         11685         280440  ruby.TZInfo.TimezoneTransitionInfo
  97:           970          23280  ruby.Gem.Version
  98:           914          21936  ruby.Gem.Requirement
 122:           592          14208  ruby.TZInfo.TimezoneOffsetInfo
 138:           382           9168  ruby.Gem.Dependency
 159:           265           6360  ruby.Gem.Specification
 201:           142           3408  ruby.ActiveSupport.TimeZone
 205:           118           2832  ruby.TZInfo.DataTimezoneInfo
 206:           118           2832  ruby.TZInfo.DataTimezone
 273:            41            984  ruby.Gem.Platform
 383:            14            336  ruby.Mime.Type
 403:            13            312  ruby.Set
 467:             8            192  ruby.ActionController.MiddlewareStack.Middleware
 476:             8            192  ruby.ActionView.Template
 487:             7            168  ruby.ActionController.Routing.DividerSegment
 508:             6            144  ruby.TZInfo.LinkedTimezoneInfo
 523:             6            144  ruby.TZInfo.LinkedTimezone
 810:             4             96  ruby.ActionController.Routing.DynamicSegment
2291:             2             48  ruby.ActionController.Routing.Route
2292:             2             48  ruby.I18n.Config
2293:             2             48  ruby.ActiveSupport.Deprecation.DeprecatedConstantProxy
2298:             2             48  ruby.ActionController.Routing.ControllerSegment
...
This time I've opted to grep out just the "ruby." items in the histogram, and the results are pretty impressive! We can see the baffling fact that there's 970 instance of Gem::Version, using at least 23280 bytes of memory. We can see the even more depressing fact that there's 11685 live instances of TZInfo::TimezoneTransitionInfo, using at least 280440 bytes.
Now that we're getting useful data, let's look at the first of our tools in more detail: jmap and jhat.
jmap and jhat
As you might guess, I do a lot of profiling in the process of developing JRuby. I've used probably a dozen different tools at different times. But the first tool I always reach for is the jmap/jhat combination.
You've seen the simple case of using jmap above, generating a histogram of the live heap. Let's take a look at an offline heap dump.
~/projects/jruby ➔ jmap -dump:live,format=b,file=heap.bin 52926
Dumping heap to /Users/headius/projects/jruby/heap.bin ...
Heap dump file created
That's how easy it is! The binary dump in heap.bin is supported by several tools: jhat (obviously), VisualVM, the Eclipse Memory Analysis Tool, and others. It's not officially a "standard" format, but it hasn't changed in a long time. Let's have a look at jhat options.
~/projects/jruby ➔ jhat
ERROR: No arguments supplied
Usage:  jhat [-stack <bool>] [-refs <bool>] [-port <port>] [-baseline <file>] [-debug <int>] [-version] [-h|-help] <file>

 -J<flag>          Pass <flag> directly to the runtime system. For
     example, -J-mx512m to use a maximum heap size of 512MB
 -stack false:     Turn off tracking object allocation call stack.
 -refs false:      Turn off tracking of references to objects
 -port <port>:     Set the port for the HTTP server.  Defaults to 7000
 -exclude <file>:  Specify a file that lists data members that should
     be excluded from the reachableFrom query.
 -baseline <file>: Specify a baseline object dump.  Objects in
     both heap dumps with the same ID and same class will
     be marked as not being "new".
 -debug <int>:     Set debug level.
       0:  No debug output
       1:  Debug hprof file parsing
       2:  Debug hprof file parsing, no server
 -version          Report version number
 -h|-help          Print this help and exit
 <file>            The file to read

For a dump file that contains multiple heap dumps,
you may specify which dump in the file
by appending "#<number>" to the file name, i.e. "foo.hprof#3".

All boolean options default to "true"
Generally you can just point jhat at a heap dump and away it goes. Occasionally if the heap is large, you may need to use the -J option to increase the maximum heap size of the JVM jhat runs in. Since we're running a Rails app, we'll bump the heap up a little bit.
~/projects/jruby ➔ jhat -J-Xmx200M heap.bin
Reading from heap.bin...
Dump file created Fri Jul 09 02:07:46 CDT 2010
Snapshot read, resolving...
Resolving 604115 objects...
[much verbose logging elided for brevity]

Chasing references, expect 120 dots........................................................................................................................
Eliminating duplicate references........................................................................................................................
Snapshot resolved.
Started HTTP server on port 7000
Server is ready.
"Server is ready"? Damn you Java people! Does everything have to be a server with you?
In this case, it's actually an incredibly useful tool. jhat starts up a small web application on port 7000 that allows you to click through the dump file. Let's see what that looks like.

Here's the front page of the tool. We see a listing of all JVM classes in the system. If you scroll to the bottom, there's a few more general functions.

Let's go with what we know and view the heap histogram again.

Here we can see that there's lots of objects taking up memory, and they're a mix of JVM-native types, JRuby implementation classes, and actual Ruby classes. In fact, here we can see our friend TZInfo::TimezoneTransitionInfo again. Let's click through.

Pretty mundane stuff so far; basically just information about the class itself. But you see at the bottom of this screenshot that we can go from here to viewing all instances of TimezoneTransitionInfo. Let's try that.

Ahh, that's more like it! Now we can see that there's a heck of a lot of these things floating around. Let's investigate a bit more and click through the first instance.

Now this is some cool stuff!
We can see that the JVM class generated for TimezoneTransitionInfo has three fields: metaClass, which points at the Ruby Class object; varTable, which is an array of Object references used for instance variables and other "internal" variables; and a flags field containing runtime flags for the object, like whether it's frozen, tainted, and so on. We can see that this object has no special flags set, and we can dig deeper into those fields if we like. We'll skip that today.
Moving further down, we see a few more amazing links. First, there's a list of all references to this object. Ahh, now we can start to investigate why they're staying in memory, even though we're not using them. We can even have jhat show us the full chains of references keeping these objects alive; a series of objects leading all the way back to one "rooted" by a thread or by global JVM state. And we can explore the other direction as well, walking all objects reachable from this one.
This is only a small part of what you can do with jmap and jhat, and they're so simple to use it feels almost criminal. But what if we want to inspect an application while it's running? Dumping heaps and analyzing them offline can tell you much of the story, but sometimes you just want to see the objects coming and going yourself. Let's move on to VisualVM.
VisualVM
VisualVM spawned out of the NetBeans profiling tools. One of the biggest complaints about the JVMs of old were that all the built-in tooling seemed to be designed for JVM engineers alone. Because Sun had the foresight to build and own their own IDE and related modules, it eventually became a natural fit to pull out the profiling tools for use by everyone. And so VisualVM was born.
On most systems with Java 6 installed, you should have a "jvisualvm" command. Let's run it now.

When you start up VisualVM, you're presented with a list of running JVMs, similar to using the 'jps' command. You can also connect to remote machines, browse offline heap and core dump files, and look through memory and CPU profiling snapshots from previous runs. Today, we'll just open up our running Rails app and see what we can see.

VisualVM connects to the running process and brings up a basic information pane with process information, JVM information, and so on. We're interested in monitoring heap usage, so let's move to the "Monitor" tab.

Already we're getting some useful information. This view shows CPU usage (currently zero, since it's an idle Rails app), Heap usage over time, and the number of JVM classes and threads that are active. We can trigger a full GC, if we'd like to tidy things up before we start poking around. But most importantly, we can do the jmap/jhat dance in one step, by clicking the Heap Dump button. Tantalizing, isn't it?

Initially, we see a basic summary of the heap: total size, number of classes and GC roots, and so on. We're looking for our friend TimezoneTransitionInfo, so let's look for it in the "Classes" pane.

Ahh, there it is, just a little ways down the list. The counts are as we expect, so let's double-click and dig a bit deeper.

Here we have a lot of the same information about object instances that we did with jhat, but presented in a much richer format. Almost everything is active; you can jump around the heap and do analysis that would take a lot of manual work very easily. Let's try another tool: the Retained Size calculator.
Because our JVM tools see all objects equally, the reported size for a Ruby object on the heap is only part of the story. There's also the variable table, the object's instance variables, and objects they reference to consider. Let's jump to a different object now, Gem::Version.
We don't want to have to scroll through the list of classes to find ruby.Gem.Version, so let's make use of the Object Query Language console. With the OQL console, you can write SQL-like queries to retrieve listings of objects in the heap. We'll search for all instances of ruby.Gem.Version.

The query runs and we get a listing of Gem::Version objects. Let's dig deeper and see how much retained memory each Version object is keeping alive.

Clicking on the "Compute Retained Sizes" link in the "Instances" pane prompts us with this dialog. We're tough...we can take it.

Reticulating splines...

So it looks like each of the Version objects take from 125 to 190 bytes for a total of 19400 bytes, most of which is from the variable table. What's in there?

Ahh...looks like there's a String and an Array. And of course we can poke around the heap ad infinatum, into and out of "native" JRuby and JVM classes, and truly get a complete picture of what our running applications look like. Now you're playing with power.
Your Turn
This is obviously only the tip of the iceberg. Tools like Eclipse Memory Analysis Tool include features for detecting leaks; VisualVM and NetBeans both allow you to turn on allocation tracing, to show where in your code all those objects are being created. There's tools for monitoring live GC behavior, and many of these tools even allow you to dig into a running heap and modify live objects. If you can dream it, there's a tool that can do it. And you get all that for free by using JRuby.
If you'd like to play with this, it all works with JRuby 1.5.1 but you won't get the nice JVM classes for Ruby classes. For that, you can pull and build JRuby master, download a 1.6.0.dev snapshot, or just wait for JRuby 1.6. And if you do play with these or other tools, I hope you'll let us know and blog about your experience!
In the future, I'll try to show some of the other tools plus some of the CPU profiling capabilities they bring to the table. For now, rest assured that if you're using JRuby, you really do have the best tools available to you.
Written on July 9, 2010