3D Charts and More with JRuby and JFreeChart
Share on:After playing with JFreeChart and JRuby and writing up a lovely blog post called “Beautiful Charts with JRuby and JFreeChart” it seems that some folks did not agree with my assessment of the charts as “beautiful” and others did not realize the power of what they’d just seen.
So, let’s see if this one grabs your attention. As before, this example is available in the headius/jruby-charts repository.
Orson Charts
Along with a comprehensive and configurable set of 2D chart formats, the JFreeChart project also ships Orson Charts, an equally extensive set of 3D chart renderers. The library has been designed to work alongside JFreeChart and has all the same support for file output and GUI integration.
So you don’t think my bar chart was beautiful? Ok, maybe you’re right. Let’s kick it up a notch!
Everything is Better in 3D
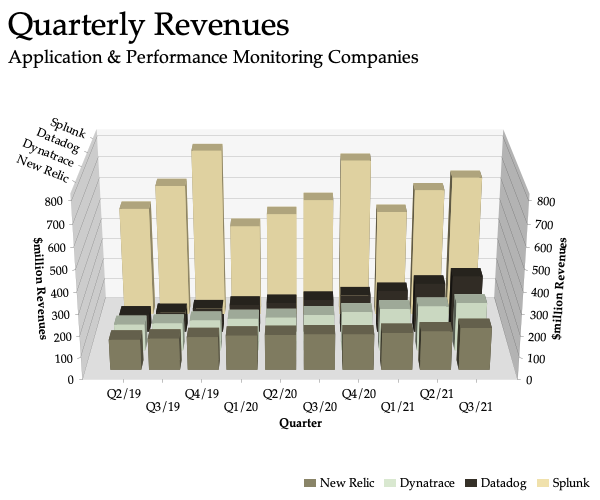
It took me about 30 minutes to port one of the Orson Charts demos, a 3D rendering of quarterly revenues for four application monitoring companies. I’ve made the following tweaks along the way:
- Data is read in from a json file using the Ruby
jsonlibrary. - The GUI and interactive elements have been removed.
- The chart is rendered to various file formats rather than to the screen.
The full source is here: 3D Bar Chart with JRuby and Orson Charts
Let’s jump in!
Adding the Dependencies
Orson Charts has a Maven artifact just like JFreeChart, so we add it to our Jarfile and re-lock the dependencies.
jar 'org.jfree:jfreechart:1.5.5'
jar 'org.jfree:org.jfree.chart3d:2.1.0'
Locking is done with lock_jars as before.
jruby-charts $ lock_jars

-- jar root dependencies --

      org.jfree:jfreechart:1.5.5:compile
      org.jfree:org.jfree.chart3d:2.1.0:compile

Jars.lock updated
Importing Classes for Cleaner Code
In my previous post, I mostly just referenced classes using their Java package + class format, but for this example we’ll import the classes ahead of time. This is an optional step; you can always just reference the classes directly.
If you want to be explicit about imports, you can use java_import which assigns a constant of the same name in the current namespace.
java_import java.awt.Color
java_import java.awt.Rectangle
java_import java.awt.image.BufferedImage
java_import javax.imageio.ImageIO
java_import org.jfree.chart3d.Chart3DFactory
java_import org.jfree.chart3d.data.DefaultKeyedValues
java_import org.jfree.chart3d.data.category.StandardCategoryDataset3D
java_import org.jfree.chart3d.interaction.StandardKeyedValues3DItemSelection
java_import org.jfree.chart3d.label.StandardCategoryItemLabelGenerator
java_import org.jfree.chart3d.legend.LegendAnchor
java_import org.jfree.chart3d.marker.CategoryMarker
You can also just assign the constants yourself, if you prefer.
Color = java.awt.Color
Rectangle = java.awt.Rectangle
BufferedImage = java.awt.image.BufferedImage
Generating the Dataset from JSON
My previous post used canned data hand-entered into the dataset object, but of course you will typically read data from a database or json-formatted data source. I have created a json data file based on the revenue demo’s data:
{
  "New Relic": {
    "Q2/19": 141.0,
    "Q3/19": 146.0,
    "Q4/19": 153.0,
    "Q1/20": 160.0,
We can read it in and populate a StandardCategoryDataset3D using idiomatic Ruby code.
require 'json'

dataset = StandardCategoryDataset3D.new
data = JSON.load(File.read("data/app_monitoring_revenue.json"))
data.each do |name, subset|
  values = DefaultKeyedValues.new
  subset.each { values.put(_1, _2) }
  dataset.add_series_as_row name, values
end
Let’s construct the chart now.
Creating and Configuring a 3D Bar Chart
The Orson Charts API feels familiar if you have used JFreeChart. This example does more customization and prettier rendering than my previous simple charts. Let’s walk through it.
chart = Chart3DFactory.create_bar_chart(
  "Quarterly Revenues",
  "Application & Performance Monitoring Companies",
  dataset, nil, "Quarter",
  "$million Revenues")
chart.chart_box_color = Color.new(255, 255, 255, 127)
chart.legend_anchor = LegendAnchor::BOTTOM_RIGHT
We use Chart3DFactory to create_bar_chart with a title, subtitle, dataset, row, column, and value axis labels (row axis left empty).
plot = chart.plot
plot.gridline_paint_for_values = Color::BLACK

renderer = plot.renderer
item_label_generator =
  StandardCategoryItemLabelGenerator.new(StandardCategoryItemLabelGenerator::VALUE_TEMPLATE)
item_selection = StandardKeyedValues3DItemSelection.new
item_label_generator.item_selection = item_selection
renderer.item_label_generator = item_label_generator
Here we set the gridline color to black and set up a basic renderer for the bar labels to hide the numeric values (we’re visualizing the data, not trying to render every value in text).
That’s about it to get the basic 3D bar chart ready! The original example also includes features like highlighting a specific column, interactively browsing the data, and other features that are more suited for a rich GUI application.
Generating Output
Let’s generate a PNG image from our chart. Unlike the previous examples, the BarChart3D class does not have a convenience method for creating and drawing into a BufferedImage, so we have a few extra lines of code here.
width, height = 600, 500
category_chart_image = BufferedImage.new(width, height, BufferedImage::TYPE_INT_RGB)
category_chart_graphics = category_chart_image.create_graphics
chart.draw(category_chart_graphics, Rectangle.new(width, height))
We create an RGB BufferedImage of the specified dimentions, get a Graphics2D object from it for writing, and tell the chart to draw itself into the specified area.
Now we can write it to a file.
category_chart_file = File.open("category_chart.png", "w")
ImageIO.write(category_chart_image, "PNG", category_chart_file.to_outputstream)
And we’ve got our chart!
Finally, we should at least pretend we’re writing production code and clean up the graphics context and the open file.
category_chart_graphics.dispose
category_chart_file.close
Bonus Round!
A number of commenters also seemed to miss the real point of my article: this is just one of thousands of libraries available to JRuby users. Maybe you don’t want this chart as a PNG and want to render it in a browser as SVG? No problem!
JFreeCharts SVG Support
Using exactly the same API, you can also output SVG. First, we’ll add the additional dependency to our Jarfile.
jar 'org.jfree:jfreechart:1.5.5'
jar 'org.jfree:org.jfree.chart3d:2.1.0'
jar 'org.jfree:org.jfree.svg:5.0.6'
After locking, we can require the libraries and render the exact same chart object to an SVG file.
require_jar 'org.jfree', 'org.jfree.svg', '5.0.6'
java_import org.jfree.svg.SVGGraphics2D

svg_graphics = SVGGraphics2D.new(width, height)
svg_graphics.defs_key_prefix = "jruby_charts"
chart.element_hinting = true
chart.draw(svg_graphics, Rectangle.new(width, height))
svg = svg_graphics.get_svg_element chart.id
File.write("category_chart.svg", svg)
And there it is!

But wait, there’s more!
JFreeCharts PDF Support
PDF generation has typically been a struggle for CRuby users, with only a few working libraries, some abandoned and most incomplete. JRuby users, on the other hand, have a large number of full-featured PDF libraries available to them. In this case, JFreeChart provides its own PDF support that integrates directly into the same API.
We just add and lock the dependency in our Jarfile:
jar 'org.jfree:jfreechart:1.5.5'
jar 'org.jfree:org.jfree.chart3d:2.1.0'
jar 'org.jfree:org.jfree.svg:5.0.6'
jar 'org.jfree:org.jfree.pdf:2.0'
And render the chart to PDF:
require_jar 'org.jfree', 'org.jfree.pdf', '2.0.1'
java_import org.jfree.pdf.PDFDocument

pdf_doc = PDFDocument.new
pdf_doc.title = "Application & Performance Monitoring Companies Revenue"
pdf_doc.author = "Charles Oliver Nutter";
page = pdf_doc.create_page(Rectangle.new(612, 468))
pdf_graphics = page.graphics2D
chart.draw(pdf_graphics, Rectangle.new(0, 0, 612, 468))
File.write("category_chart.pdf", pdf_doc.pdf_bytes)
The Bottom Line
The point of these posts is not to wow you with my amazing chart-designing skills. You can get your own hands dirty with these APIs and customize them to your heart’s content. I’m a programmer, not a graphic designer!
What I really want you get out of this is that it’s easy and fun to use these libraries in JRuby… without ever leaving Ruby. We’re talking about thousands of battle-tested, production ready tools that you can integrate into your applications today. No other Ruby implementation can give you that as quickly and easily.
JRuby is being actively developed by me and the rest of the JRuby team. We’re working full-time to deliver the best possible JVM Ruby runtime that we can. I just want to continue building tools that Rubyists like you will find useful!
So, what would you like to see next?
Join the discussion on Reddit!
JRuby Support and Sponsorship
This is a call to action!
JRuby development is funded entirely through your generous sponsorships and the sale of commercial support contracts for JRuby developers and enterprises around the world. If you find my work exciting or believe it is important your company or your projects, please consider partnering with me to keep JRuby strong and moving forward!