JRuby and JDK 25: Startup Time with AOTCache
Share on:JDK 25 is the newest LTS release since JDK 21, and it ships with a gaggle of amazing VM-level features. This post will cover one of the most important improvements for command-line ecosystems like JRuby’s: the AOTCache (ahead-of-time cache) and its ability to pre-optimize code for future runs.
We’ll explore how AOTCache can speed up your JRuby workflow, starting with a discussion of JRuby startup time challenges and finishing with “coming soon” features that didn’t quite make it into the JDK 25 release.
The Challenge of Fast Startup on the JVM
It’s worth taking a quick look at why startup time has been such a difficult challenge for JRuby, and how we’ve worked to improve it over the years.
Why does JRuby start up slowly?
Whenever folks ask me “what’s the main issue I’ll have migrating to JRuby” the answer is almost always “startup time”. If the startup time problem had been solved for us 20 years ago, JRuby would already be the de-facto production Ruby for most developers. So why haven’t we just fixed it?
The unfortunate answer is that it’s really not our fault.
Starting from Scratch
There’s many things about Ruby, JRuby, and the JVM that contribute to slow startup:
- Ruby applications typically start from uncompiled source every time you run a command, and most of these commands load dozens or hundreds of source files. We have to re-parse and re-compile all that code every time.
- JRuby’s internal representation of Ruby code starts out interpreted, to reduce the overhead of optimizing code that’s only run once. We delay full optimization until we know methods will be used repeatedly.
- JRuby itself is compiled Java bytecode, which must be loaded into the JVM from the filesystem and interpreted by the JVM. Like JRuby’s mixed-mode runtime, the JVM defers optimization of that code until it can analyze and profile code. This means the JRuby parser, compiler, interpreter, core classes, and even our JIT compiler all start out “cold”.
- The JDK itself is largely written in Java, so even the platform JRuby is built upon takes some time to optimize.
Even though we’ve made great improvements to JRuby’s startup, like [reducing memory allocation] and [deferring initialization of rarely-used state], we’re fighting an uphill battle. Most of the startup delay is due to the JVM itself.
Here’s JRuby 10 running a simple command line with no startup-time help on JDK 21:
jruby -e 1 1.63s user 0.08s system 181% cpu 0.943 total
It’s not the end of the world, but 943ms to basically run “hello, world” isn’t great.
Comparing with CRuby
Where JRuby has many layers of optimization, CRuby starts out with much of its code already optimized:
- The parser, compiler, interpreter, and most of the core classes are written in C and start as native code.
- The CRuby boot process has been refined for 30 years to start up as fast as possible.
As a result, CRuby takes about 45ms for its baseline startup (around 20x faster than JRuby’s time above).
This design does put some hard limits on CRuby’s runtime optimizations, but it also sets a high bar for JRuby. Challenge accepted! Let’s see what we can do to narrow that gap.
What happens once the JVM optimizes JRuby?
Fortunately for JRuby users, the JVM doesn’t take too long to kick in, and once it does we can start to see the true performance of JRuby.
Let’s try a more real-world example, running a fairly heavy command: gem list with about 88 gems.
gem_list_timing.rb
20.times {
  t = Time.now
  org.jruby.Main.main(%w[-S gem list].to_java(:string))
  $stderr.puts "iteration #{_1}: #{Time.now - t}"
}
This simple script runs in JRuby and basically just re-launches additional JRuby instances in the same process. Here’s the output of timings from stderr:
$ jruby gem_list_timing.rb > /dev/null
iteration 0: 1.0590579999999998
iteration 1: 0.435281
iteration 2: 0.39674800000000005
iteration 3: 0.40792199999999995
iteration 4: 0.358851
iteration 5: 0.327706
iteration 6: 0.356299
iteration 7: 0.383793
iteration 8: 0.306416
iteration 9: 0.29007
iteration 10: 0.301724
iteration 11: 0.391308
iteration 12: 0.302654
iteration 13: 0.2939
iteration 14: 0.300466
iteration 15: 0.301517
iteration 16: 0.285803
iteration 17: 0.316092
iteration 18: 0.28180099999999997
iteration 19: 0.280565
Even though the first iteration here is actually the second time JRuby has booted in this process (the JRuby running the script precedes it), we’re still taking over a second just to list installed gems. But the JVM optimizations kick in quickly, with the second iteration taking half as much time and the final iteration (still getting faster) taking a bit over one-quarter as much time.
Improving startup one step at a time
Clearly, JRuby can run simple commands fast once the JVM gets going. Our challenge has been finding ways to shorten that curve without sacrificing JRuby functionality. Let’s explore a few of these tricks.
Technique #1: Do Less
One of the simplest ways to eliminate startup-time overhead is to simply do less of it.
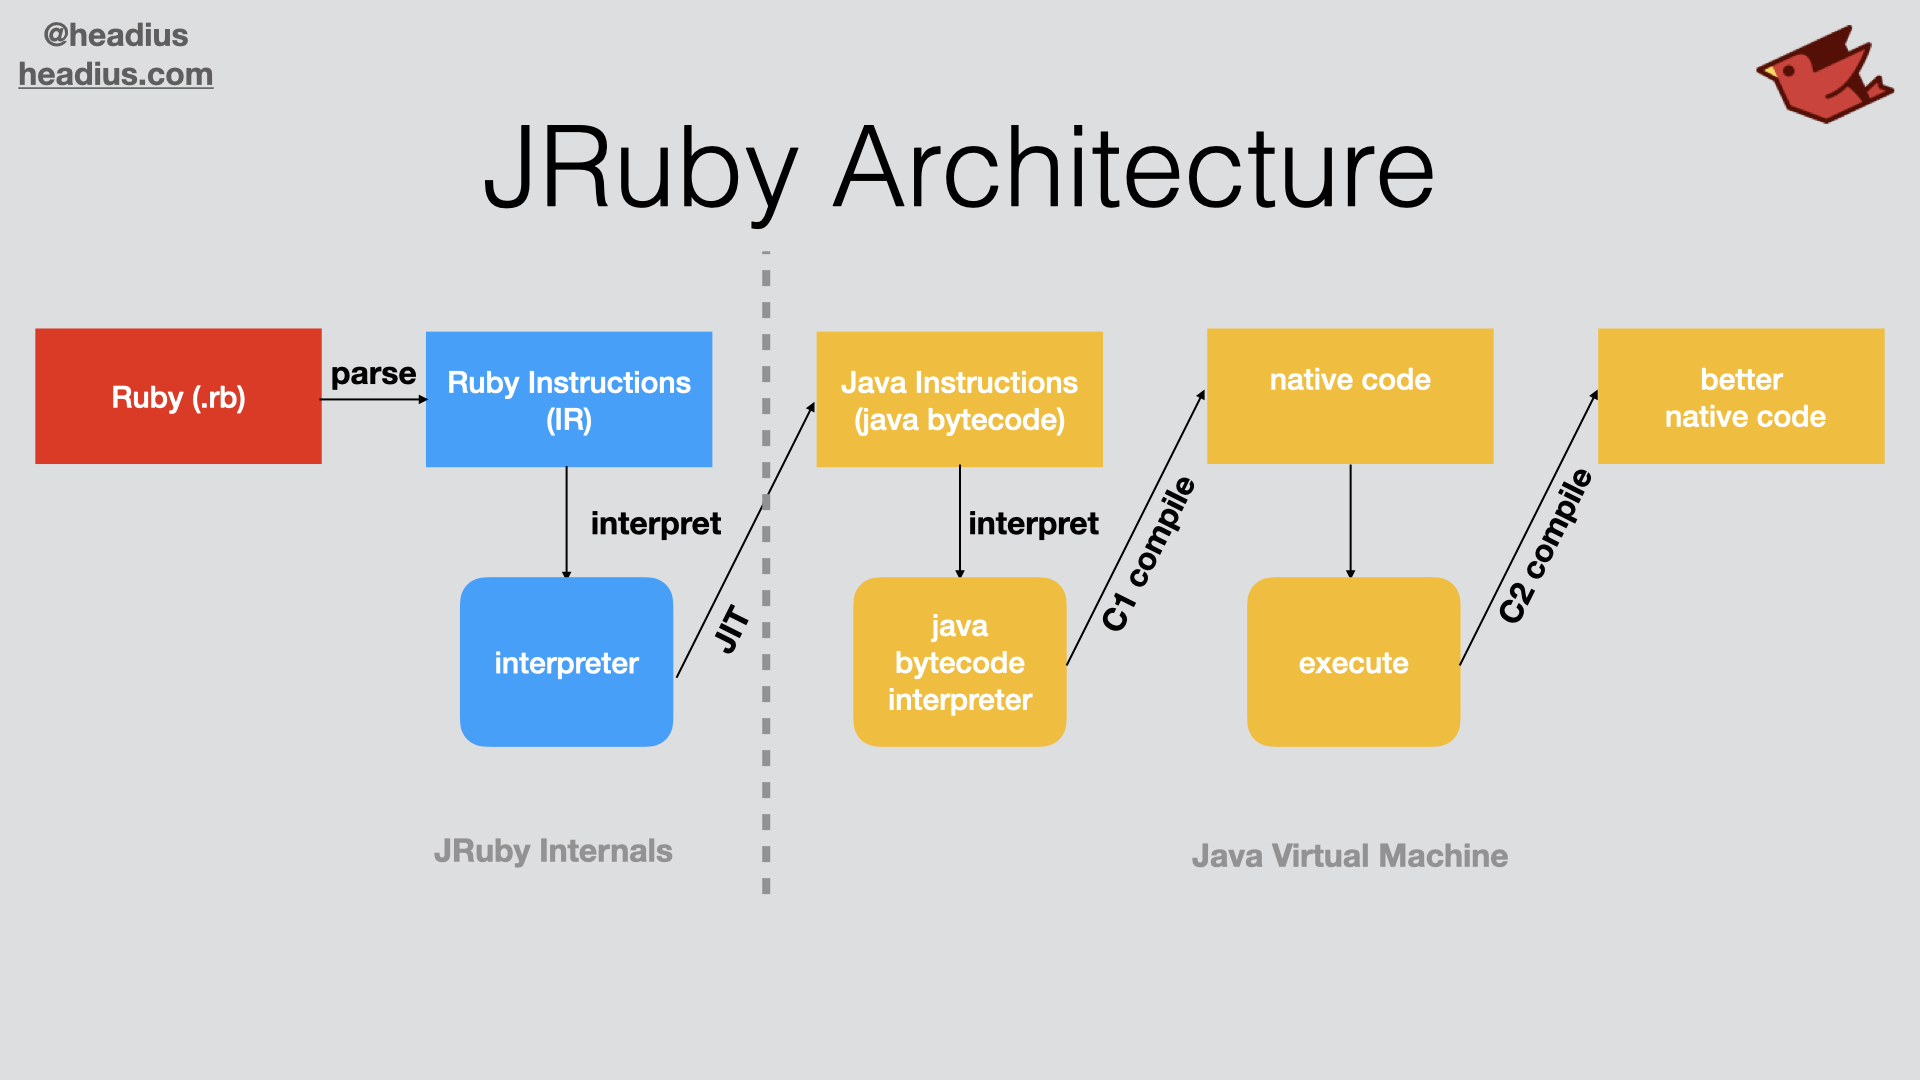
You can see in the diagram above that there are many phases to running JRuby code on the JVM:
- We parse and compile Ruby to our intermediate representation (IR)
- We interpret that Ruby IR for a while
- Eventually, we compile our IR into JVM bytecode
- The JVM interprets that bytecode for a while
- An early, simple optimizer in the JVM turns that bytecode into semi-optimized native code
- That native code continues to be profiled and analyzed
- A later, profile-driven optimizer recompiles the bytecode into optimized native code
Of course by the time we reach that last stage, short commands may already have exited, and we’ve wasted a lot of effort optimizing code that hardly gets run.
Realizing that many commands in a typical Ruby workflow don’t require the highest-performing execution, we introduced a development mode flag: --dev
$ time jruby -e 1
jruby -e 1  1.63s user 0.08s system 181% cpu 0.941 total
$ time jruby --dev -e 1
jruby --dev -e 1  0.82s user 0.07s system 123% cpu 0.723 total
This example runs a trivial Ruby script that just evaluates the number 1 and exits. JRuby without any flags takes 941ms. When we use the --dev flag, however, that time reduces to 723ms. What’s happening here?
The --dev flag basically turns off several stages in the optimization pipeline, so we start running more quickly and avoid doing optimizations that won’t be useful:
- JRuby’s bytecode compiler is disabled, so we just stay in the JRuby IR interpreter.
- The JVM’s second-stage profiled optimizer is disabled, so it just generates simple native code for JRuby’s internal logic and the rest of the JDK.
- There’s a few other tweaks that also have a small impact.
This has been, up until recently, the best way to improve JRuby startup. Let’s review a newer technique I blogged about a few months ago, the Application Class Data Sharing.
Technique #2: Preprocess JRuby and JDK code with AppCDS
Application Class Data Sharing (AppCDS) is an OpenJDK feature that allows you to save off some of the early boot-time work of loading and processing JVM class files, eliminating that processing for future runs. In my post Boosting JRuby Startup with AppCDS and AOT caching, I walk through the details of “AppCDS” and show how you can use it with JRuby.
Since then, we’ve released JRuby 10 and updates for JRuby 9.4 that will automatically use AppCDS to improve startup! This feature can be disabled with the --nocache flag. Let’s review startup performance with and without AppCDS.
# JRuby with no startup help
$ time jruby --nocache -e 1
jruby --nocache -e 1  1.61s user 0.08s system 182% cpu 0.925 total

# JRuby with AppCDS (on by default)
$ time jruby -e 1
jruby -e 1  1.28s user 0.06s system 191% cpu 0.702 total

# JRuby with "dev" mode only
$ time jruby --nocache --dev -e 1
jruby --nocache --dev -e 1  0.83s user 0.07s system 125% cpu 0.717 total

# JRuby with "dev" mode and AppCDS
$ time jruby --dev -e 1
jruby --dev -e 1  0.63s user 0.04s system 118% cpu 0.567 total
Now we’re talking! With AppCDS, base JRuby startup in normal mode (with full optimization still enabled) drops down to 702ms, less than “dev” mode alone. And JRuby with both AppCDS and “dev” mode gets down to 567ms!
At these speeds, startup time becomes almost a non-issue, but what about a heavier command like gem list?
# gem list with no startup help
$ time jruby --nocache -S gem list > /dev/null
jruby --nocache -S gem list > /dev/null  3.44s user 0.14s system 215% cpu 1.663 total

# gem list with AppCDS
$ time jruby -S gem list > /dev/null
jruby -S gem list > /dev/null  3.07s user 0.14s system 229% cpu 1.397 total

# gem list with "dev" mode only
$ time jruby --nocache --dev -S gem list > /dev/null
jruby --nocache --dev -S gem list > /dev/null  1.52s user 0.11s system 141% cpu 1.148 total

# gem list with "dev" mode and AppCDS
$ time jruby --dev -S gem list > /dev/null
jruby --dev -S gem list > /dev/null  1.31s user 0.09s system 145% cpu 0.967 total
Ok, for a more “real world” command line, we’re still slower than we’d like taking nearly a second just to list gems (similar to “iteration 0” in our looping test). We need to do better!
Technique #3: Upgrade the JDK
There’s a saying in the Java world: “If you want better performance… just wait a bit.” This reflects two truths about the JVM:
- It might take a while to optimize, for many reasons spelled out above.
- Newer releases of the JDK almost always run faster than older versions.
Let’s try the above AppCDS examples with JDK 25 instead of JDK 21:
# gem list with no startup help
$ time jruby --nocache -S gem list > /dev/null
jruby --nocache -S gem list > /dev/null  3.30s user 0.14s system 222% cpu 1.546 total

# gem list with AppCDS
$ time jruby -S gem list > /dev/null
jruby -S gem list > /dev/null  3.02s user 0.14s system 234% cpu 1.350 total

# gem list with "dev" mode only
$ time jruby --nocache --dev -S gem list > /dev/null
jruby --nocache --dev -S gem list > /dev/null  1.51s user 0.16s system 149% cpu 1.116 total

# gem list with "dev" mode and AppCDS
$ time jruby --dev -S gem list > /dev/null
jruby --dev -S gem list > /dev/null  1.40s user 0.13s system 158% cpu 0.966 total
There’s some modest improvements here just from upgrading:
gem listwith no help reduces from 1663ms to 1546ms (7.1% improvement).gem listwith AppCDS reduces from 1397ms to 1350ms (3.4% improvement).gem listwith “dev” mode reduces from 1148ms to 1116ms (2.8% improvement).gem listwith both “dev” mode and AppCDS reduces from 0.967ms to 0.966ms (less than 1% improvement).
We’re seeing gains, but they’re not super impressive. But JDK 25 has an ace up its sleeve: AOTCache.
Technique #4: Save optimization data across runs
The features in JDK 25 build on the capabilities of AppCDS and add several enhancements compared to JDK 21:
- AOTCache replaces AppCDS as the primary mechanism for improving startup (JEP 843: “Ahead-of-Time Class Loading & Linking” shipped in JDK 24)
- Creating an AOTCache is made easier, with only one “training” step required (JEP 514: “Ahead-of-Time Command-Line Ergonomics”)
- The AOTCache can now save optimization profiles from a training run to aid optimization of future runs (JEP 515: “Ahead-of-Time Method Profiling”)
Let’s try switching from AppCDS to the AOTCache.
First, we need to do a training run to allow the JVM to record optimization profiles. We’ll run JRuby in a loop within a single process and save the resulting AOTCache.
baseline_training.rb
100.times {
  ruby = org.jruby.Ruby.new_instance
  ruby.eval_scriptlet "1"
  print "."
  ruby.tear_down
}
puts
This time, rather than running JRuby’s main entry point, we create new JRuby runtime instances in a loop, evaluate some code, and tear them down. Doing this 100 times gives the JVM a chance to “learn” how JRuby boots up and executes.
To train with AOTCache, we disable AppCDS (--nocache) and use the JVM flag -XX:AOTCacheOutput=jruby.aot:
$ jruby --nocache -J-XX:AOTCacheOutput=jruby.aot baseline_training.rb
....................................................................................................
[5.678s][warning][aot] Skipping org/jruby/util/JDBCDriverUnloader: Duplicated unregistered class
[5.678s][warning][aot] Skipping org/jruby/util/JDBCDriverUnloader: Duplicated unregistered class
...
[5.681s][warning][aot] Skipping org/joda/time/base/BaseDateTime: Old class has been linked
[5.681s][warning][aot] Skipping jdk/proxy2/$Proxy28: Unsupported location
Temporary AOTConfiguration recorded: jruby.aot.config
Launching child process /Library/Java/JavaVirtualMachines/zulu-25.jdk/Contents/Home/bin/java to assemble AOT cache jruby.aot using configuration jruby.aot.config
Picked up JAVA_TOOL_OPTIONS: -Djava.class.path=: --add-opens=java.base/java.io=org.jruby.dist --add-opens=java.base/java.nio.channels=org.jruby.dist --add-opens=java.base/sun.nio.ch=org.jruby.dist --add-opens=java.management/sun.management=org.jruby.dist -Xss2048k -Djffi.boot.library.path=/Users/headius/work/jruby/lib/jni -Djava.security.egd=file:/dev/urandom --enable-native-access=org.jruby.dist --sun-misc-unsafe-memory-access=allow --module-path=/Users/headius/work/jruby/lib/jruby.jar -Djruby.home=/Users/headius/work/jruby -Djruby.lib=/Users/headius/work/jruby/lib -Djruby.script=jruby -Djruby.shell=/bin/sh -XX:AOTCacheOutput=jruby.aot -XX:AOTConfiguration=jruby.aot.config -XX:AOTMode=create
Reading AOTConfiguration jruby.aot.config and writing AOTCache jruby.aot
[0.285s][warning][aot] Skipping org/joda/time/tz/FixedDateTimeZone: Unlinked class not supported by AOTClassLinking
...
[0.286s][warning][aot] Skipping org/joda/time/DateTimeZone: Unlinked class not supported by AOTClassLinking
AOTCache creation is complete: jruby.aot 60653568 bytes
Removed temporary AOT configuration file jruby.aot.config
$
Now, we can run our previous tests, passing the JVM flag -XX:AOTCache=jruby.aot to use the generated AOTCache file:
# JRuby with AOTCache
$ time jruby --nocache -J-XX:AOTCache=jruby.aot -e 1
jruby --nocache -J-XX:AOTCache=jruby.aot -e 1  1.10s user 0.08s system 203% cpu 0.581 total

# JRuby with "dev" mode and AOTCache
$ time jruby --nocache --dev -J-XX:AOTCache=jruby.aot -e 1
jruby --nocache --dev -J-XX:AOTCache=jruby.aot -e 1  0.65s user 0.07s system 139% cpu 0.518 total
Wow! Baseline startup with AOTCache is almost as fast as AppCDS with “dev” mode (581ms vs 567ms), and AOTCache plus “dev” mode gives us our best time yet: 518ms!
We can see that gem list has similar improvements:
# gem list with AOTCache
$ time jruby --nocache -J-XX:AOTCache=jruby.aot -S gem list > /dev/null
jruby --nocache -J-XX:AOTCache=jruby.aot -S gem list > /dev/null  2.69s user 0.13s system 244% cpu 1.152 total

# gem list with "dev" mode and AOTCache
$ time jruby --nocache --dev -J-XX:AOTCache=jruby.aot -S gem list > /dev/null
jruby --nocache --dev -J-XX:AOTCache=jruby.aot -S gem list > /dev/null  1.39s user 0.11s system 173% cpu 0.861 total
Another record… gem list with 88 gems is now comfortably less than a second, at 861ms.
Can we do better by training our AOTCache using gem list?
gem_list_training.rb*
100.times {
  org.jruby.Main.main(%w[-S gem list].to_java(:string))
}
Yes we can!
$ time jruby --nocache --dev -J-XX:AOTCache=jruby.aot -S gem list > /dev/null
jruby --nocache --dev -J-XX:AOTCache=jruby.aot -S gem list > /dev/null  1.39s user 0.17s system 189% cpu 0.825 total
New record: 825ms!
Technique #5: Save optimized code!
But wait, there’s more!
The features of AOTCache that shipped with JDK 25 are obviously outstanding, and have delivered the best startup times yet for JRuby users. But the OpenJDK folks haven’t been standing still, and there’s even more coming!
Project Leyden is the OpenJDK project where this work has been going on, and in late August they released a second Early Access build containing previews of that work. Several features that didn’t make the cut are available for testing and experimentation:
- AOT compilation of Java methods: Cache compiled native code.
- AOT generation of Dynamic Proxies and reflection data: Cache optimized forms of commonly used JVM metaprogramming features.
- AOT optimization for class lookup: Cache class lookup data to avoid doing the same lookups again.
The best part? We can try out these features just by downloading Leyden EA2 and training the AOTCache as before.
I present to you the fastest JRuby startup times ever seen on a standard JDK:
# baseline startup with AOTCache (Leyden EA2)
$ time jruby --nocache -J-XX:AOTCache=jruby.aot -e 1
jruby --nocache -J-XX:AOTCache=jruby.aot -e 1  0.55s user 0.06s system 131% cpu 0.462 total

# baseline startup with "dev" mode and AOTCache (Leden EA2)
$ time jruby --nocache --dev -J-XX:AOTCache=jruby.aot -e 1
jruby --nocache --dev -J-XX:AOTCache=jruby.aot -e 1  0.46s user 0.06s system 122% cpu 0.423 total

# gem list with AOTCache (Leyden EA2)
$ time jruby --nocache -J-XX:AOTCache=jruby.aot -S gem list > /dev/null
jruby --nocache -J-XX:AOTCache=jruby.aot -S gem list > /dev/null  1.82s user 0.11s system 186% cpu 1.035 total

# gem list with "dev" mode and AOTCache (Leyden EA2)
$ time jruby --nocache --dev -J-XX:AOTCache=jruby.aot -S gem list > /dev/null
jruby --nocache --dev -J-XX:AOTCache=jruby.aot -S gem list > /dev/null  1.07s user 0.09s system 142% cpu 0.815 total
JRuby baseline startup less than half a second!
Gem list down to only 815ms!
Amazing!
What’s Next?
JRuby Enhancements
Using all our tricks and the latest enhancements to the JVM, we’ve managed to improve JRuby startup time by a huge amount:
- Baseline startup went from 943ms to 423ms
gem listwent from 1663ms to 815ms
That’s over 50% faster startup across the board, with more improvements on the way!
Over the next few weeks, the JRuby team will be transitioning our automatic startup optimizations from AppCDS to AOTCache, to give users the best possible startup time for daily use. But you’ve already seen how you can experiment with these features today. Try it out and let us know how it goes!
Project Leyden Collaboration
We’re also going to be collaborating with the Project Leyden team to share our findings and help them to improve the AOTCache. We’re obviously very excited about this work, since it may finally solve the #1 complaint about using JRuby.
What will the Ruby world be like when JRuby users can have true parallelism, world-class garbage collection, and fast straight-line performance without compromising startup time?
We’re about to find out.
Join the discussion on Reddit!
JRuby Support for Your Project
This is a call to action!
JRuby development is made possible by our primary sponsor, Headius Enterprises, offering a range of professional development and support resources for your team. You can choose JRuby for your next project knowing that you’ve got the world’s best JRuby experts standing by to help.
If you are interested in scaling Ruby to new heights, deploying your applications in large enterprises, or taking advantage of JVM features like world-class JIT compilers, battle-tested libraries, and leading-edge AI tools, you need to be using JRuby. Let us help you.
Sign up for expert JRuby support from Headius Enterprises!
If you find this article or my work on JRuby to be interesting and useful, you can also sponsor me directly on GitHub. Your contributions help ensure the JRuby project keeps moving forward!