Finding Leaks in Ruby Apps with Eclipse Memory Analyzer
Share on:
After my post on Browsing Memory the JRuby Way, one commenter and several other folks suggested I actually show using Eclipse MAT with JRuby. So without further ado...
The Eclipse Memory Analyzer, like many Eclipse-based applications, starts up with a "for dummies" page linking to various actions.

The most interesting use of MAT is to analyze a heap dump in a bit more interactive way than with the "jhat" tool. The analysis supports the "jmap" dump format, so we'll proceed to get a jmap dump of a "leaky" Rails application.
I've added this controller to a simple application:
Some genius has decided to save all recent request parameters into a constant on the LeakyController, keyed by time, wrapped in a custom type, and never cleaned out. Perhaps this was done temporarily for debugging, or perhaps we have a moron on staff. Either way, we need to find this problem and fix it.
We'll run this application and crank 10000 requests through the /leaky index, so the final request should output "There are 10000 elements now!"
After 10000 requests have completed, we notice this application seems to grow and grow until it maxes out the heap (JRuby, being on the JVM, automatically limits heap sizes for you). Let's start by using jmap to investigate the problem.
We can see our old friend TimezoneTransitionInfo in there, but of course we've learned to accept that one. But what's this LeakyController::MyData object we've apparently got 10000 instances of? Where are they coming from? Who's holding on to them?
At this point, we can proceed to get a memory dump and move over to MAT, or have MAT acquire and open the dump in one shot, similar to VisualVM. Let's have MAT do it for us.
Getting Our Heap Into MAT
(Caveat: While preparing this post, I discovered that the jmap tool for the current OS X Java 6 (build 1.6.0_20-b02-279-10M3065) is not properly dumping all information. As a result, many fields and objects don't show up in dump analysis tools like MAT. Fortunately, there's a way out; on OS X, you can grab Soylatte or OpenJDK builds from various sources that work properly. In my case, I'm using a local build of OpenJDK 7.)
From the File menu, we select Acquire Heap Dump.

The resulting dialog should be familiar, since it lists the same JVM processes the "jps" command listed above. (If you had to specify a specific JDK home, like me, you'll need to click the "Configure" button and set the "jdkhome" flag" for "HPROF jmap dump provider".)

We'll pick our Rails instance (pid 61976) and proceed.
MAT connects to the process, pulls a heap dump to disk, and immediately proceeds to parse and open it.
Once it has completed parsing, we're presented with a few different paths to follow.

On other days, we might be interested in doing some component-by-component browsing to look for fat objects or minor leaks, or we might want to revisit the results of previous analyses against this heap. But today, we really need to figure out this MyData leak, so we'll run the Leak Suspects Report.
Leak Suspects?
Are you kidding? A tool that can search out and report possible leaks in a running system? Yes, Virginia, there is a Santa Claus!
This is the good side of the "plague of choices" we have on the JVM. Because there's so many tools for almost every basic purpose (like the dozen – at least – memory inspection tools), tool developers have moved on to more specific needs like leak analysis. MAT is my favorite tool for leak-hunting (and it uses less memory than jhat for heap-browsing, which is great for larger dumps).
Once MAT has finished chewing on our heap, it presents a pie chart of possible leak suspects. The logic used essentially seeks out data structures whose accumulated size is large in comparison to the rest of the heap. In this case, MAT has identified three suspects that in total comprise over half of the live heap data.

Scrolling down we start to get details about these leak candidates.

So there's a Hash, a Module, and 711 Class objects in our list of suspects. The Class objects are probably just loaded classes, since the JRuby core classes and additional classes loaded from Rails and its dependent libraries will easily number in the hundreds. We'll ignore that one for now. There's also an unusually large Module taking up almost 4MB of memory. We'll come back to that.
The Hash seems like the most likely candidate. Let's expand that.
The first new block of information gives us a list of "shortest paths" to the "accumulation point", or the point at which all this potentially-leaking data is gathering. There's more to this in the actual application, but I'm showing the top of the "path" here.

At the top of this list, we see the RubyHash object originally reported as a suspect, and a tree of objects that lead to it. In this case, we go from the Hash itself into a ConcurrentHashMap (note that we're hiding nothing here; you can literally browse anything in memory) which in turn is referenced by the "constants" field of a Class. So already we know that this hash is being referenced in some class's constant table. Pretty cool, eh?
Let's make sure we've got the right Hash and not some harmless data structure inside Rails. If we scroll down a bit more, we see a listing of all the objects this Hash has accumulated. Let's see what's in there.
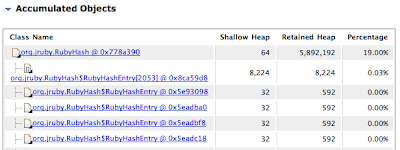
Ok, so it's a hashtable structure with a table of entries. Can we get more out of this?
Of course like most of these tools, just about everything is clickable. We can dive into one of the hash entries and see what's in there. Clicking on an entry gives us several new ways to display the downstream objects we've managed to aggregate. In this case, we'll just do "List Objects", and the suboption "With Outgoing References" for downstream data.

Now finally in the resulting view of this particular RubyHashEntry, we can see that our MyData object is happily tucked away inside.

Ok, so we definitely have the right data structure. Not only that, but we can see that the entry's "key" is a Time object (org.jruby.RubyTime). Let's go back to the "Shortest Paths" view and examine the ConcurrentHashMap entry that's holding this Hash object. Each entry in this hash maps a constant name to a value, so we should be able to see which constant is holding the leaking references.
(At this point you'll see the side effects of my switch to OpenJDK 7; the memory addresses have changed, but the structure is the same.)

We'll do another "List Objects" "with outgoing references" against the the HashEntry object immediately referencing our RubyHash.

And there it is! In the "key" field of the HashEntry, we see our constant name "LEAKING_ARRAY".
What About That Module?
Oh yeah, what about that Module that showed up in the leak suspects? It was responsible for almost 4MB of the heap. Let's go back and check it out.

A-ha! Eclipse MAT has flagged the Gem module as being a potential leak suspect. But why? Let's go back to the suspect report and look at the Accumulated Objects by Class table, toward the bottom.

Ok, so the Gem module eventually references nearly6000 Gem::Specification objects, which makes up the bulk of our 3.8MB. I guarantee I don't have 6000 gem versions installed. Perhaps that's something that RubyGems should endeavor to fix? Perhaps we've just used JRuby and Eclipse MAT to discover either a leak or wasteful memory use in RubyGems?
Evan Phoenix pointed out that I misread the columns. It's actually 249 Specification objects, their "self" size is almost 6000 bytes, and their "retained" size is 3.8MB. But that gives me an opportunity to show off another feature of MAT: Customized Retained Set calculation.
In this case, the retained size seems a bit suspect. Could there really be 3.8MB of data kept alive by Gem::Specification objects? It seems like a bit much, to be sure, but digging through the tree of references from the Gem module down shows there's several references to classes and modules, which in turn reference constant tables, method tables, and so on. How can we filter out that extra noise?
First we'll return to the view of the Gem module (two screenshots up) by going back to leak suspect #2, expanding "Shortest Paths". The topmost RubyModule in that list is the Gem module, so we're all set to calculate a Customized Retained Set.
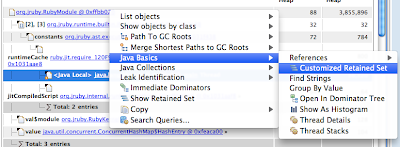
The resulting dialog provides a list of options through which you can specify classes or fields to ignore when calculating the retained set from a given starting point. In this case, it's simple enough to filter out org.jruby.RubyClass and org.jruby.RubyModule, so that references from Gem::Specification back into the class/module hierarchy don't get included in calculations.

Which results in a similar view to those we've seen, but with objects sorted by retained heap.
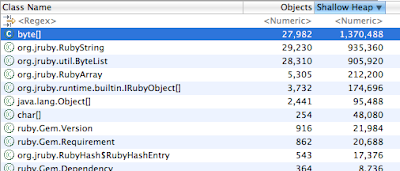
Well what the heck? It looks like it's all String data?
JRuby's String implementation is an org.jruby.RubyString object, aggregating an org.jruby.util.ByteList object, aggregating a byte array, so the top three entries there in total are essentially all String memory. The best way to investigate where they're coming from is to do "List Objects" on RubyString, but instead of "with outgoing references" we'll use "with incoming references" to show where all those Strings are coming from.
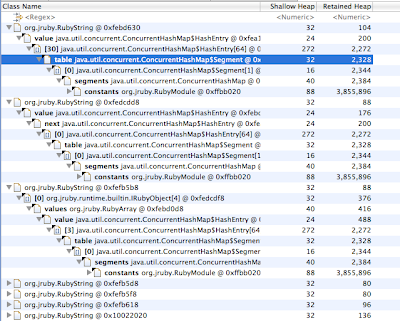
Finally we have a view that lets us hunt through all these strings and see where they're coming from. Poking at the first few shows they're stored in constant tables of the Gem module (that last RubyModule I haven't expanded in). That's probably not a big deal. But if we sort the the list of RubyString objects by their retained sizes, we get a different picture of the system.

If we dig into the *largest* String objects, they appear to be referenced by Gem::Specification instance variables! So there's probably something worth investigating here.
It's also worth noting that any Ruby application is going to have a lot of Strings in it, so this isn't all that unusual to see. But it's nice to have a tool that lets you investigate potential inefficiencies (even down to the raw bytes!), and it's nice to know that at least some of that retained data for the Gem module is "real" and not just references back into the class hierarchy.
(And I'm not convinced all those Strings really *need* to be alive...but you're welcome to take it from here!)
Your Turn
Eclipse MAT is probably one of the nicest of the free tools. In addition to object browsing, leak detection, GC root analysis, and object query language support, there's a ton of other features, both in the main distribution and available from third parties. If you're hunting for memory leaks, or just want to investigate the memory usage of your (J)Ruby application, MAT is a tool worth playing with (and as always, I hope you will blog and report your experiences!)
The Eclipse Memory Analyzer, like many Eclipse-based applications, starts up with a "for dummies" page linking to various actions.

The most interesting use of MAT is to analyze a heap dump in a bit more interactive way than with the "jhat" tool. The analysis supports the "jmap" dump format, so we'll proceed to get a jmap dump of a "leaky" Rails application.
I've added this controller to a simple application:
class LeakyController < ApplicationController
  class MyData
    def initialize(params)
      @params = params
    end
  end

  LEAKING_ARRAY = {}
  def index
    LEAKING_ARRAY[Time.now] = MyData.new(params)
    render :text => "There are #{LEAKING_ARRAY.size} elements now!"
  end
end
Some genius has decided to save all recent request parameters into a constant on the LeakyController, keyed by time, wrapped in a custom type, and never cleaned out. Perhaps this was done temporarily for debugging, or perhaps we have a moron on staff. Either way, we need to find this problem and fix it.
We'll run this application and crank 10000 requests through the /leaky index, so the final request should output "There are 10000 elements now!"
~ ➔ ab -n 10000 http://localhost:3000/leaky
This is ApacheBench, Version 2.3 <$Revision: 655654 $>
Copyright 1996 Adam Twiss, Zeus Technology Ltd, http://www.zeustech.net/
Licensed to The Apache Software Foundation, http://www.apache.org/

Benchmarking localhost (be patient)
Completed 1000 requests
Completed 2000 requests
...
After 10000 requests have completed, we notice this application seems to grow and grow until it maxes out the heap (JRuby, being on the JVM, automatically limits heap sizes for you). Let's start by using jmap to investigate the problem.
~ ➔ jps -l
61976 org/jruby/Main
61999 sun.tools.jps.Jps
61837

~ ➔ jmap -histo 61976 | grep " ruby\." | head -5
 37:         11685         280440  ruby.TZInfo.TimezoneTransitionInfo
 40:         10000         240000  ruby.LeakyController.MyData
133:           970          23280  ruby.Gem.Version
137:           914          21936  ruby.Gem.Requirement
170:           592          14208  ruby.TZInfo.TimezoneOffsetInfo
We can see our old friend TimezoneTransitionInfo in there, but of course we've learned to accept that one. But what's this LeakyController::MyData object we've apparently got 10000 instances of? Where are they coming from? Who's holding on to them?
At this point, we can proceed to get a memory dump and move over to MAT, or have MAT acquire and open the dump in one shot, similar to VisualVM. Let's have MAT do it for us.
Getting Our Heap Into MAT
(Caveat: While preparing this post, I discovered that the jmap tool for the current OS X Java 6 (build 1.6.0_20-b02-279-10M3065) is not properly dumping all information. As a result, many fields and objects don't show up in dump analysis tools like MAT. Fortunately, there's a way out; on OS X, you can grab Soylatte or OpenJDK builds from various sources that work properly. In my case, I'm using a local build of OpenJDK 7.)
From the File menu, we select Acquire Heap Dump.

The resulting dialog should be familiar, since it lists the same JVM processes the "jps" command listed above. (If you had to specify a specific JDK home, like me, you'll need to click the "Configure" button and set the "jdkhome" flag" for "HPROF jmap dump provider".)

We'll pick our Rails instance (pid 61976) and proceed.
MAT connects to the process, pulls a heap dump to disk, and immediately proceeds to parse and open it.

Once it has completed parsing, we're presented with a few different paths to follow.

On other days, we might be interested in doing some component-by-component browsing to look for fat objects or minor leaks, or we might want to revisit the results of previous analyses against this heap. But today, we really need to figure out this MyData leak, so we'll run the Leak Suspects Report.
Leak Suspects?

Are you kidding? A tool that can search out and report possible leaks in a running system? Yes, Virginia, there is a Santa Claus!
This is the good side of the "plague of choices" we have on the JVM. Because there's so many tools for almost every basic purpose (like the dozen – at least – memory inspection tools), tool developers have moved on to more specific needs like leak analysis. MAT is my favorite tool for leak-hunting (and it uses less memory than jhat for heap-browsing, which is great for larger dumps).
Once MAT has finished chewing on our heap, it presents a pie chart of possible leak suspects. The logic used essentially seeks out data structures whose accumulated size is large in comparison to the rest of the heap. In this case, MAT has identified three suspects that in total comprise over half of the live heap data.

Scrolling down we start to get details about these leak candidates.

So there's a Hash, a Module, and 711 Class objects in our list of suspects. The Class objects are probably just loaded classes, since the JRuby core classes and additional classes loaded from Rails and its dependent libraries will easily number in the hundreds. We'll ignore that one for now. There's also an unusually large Module taking up almost 4MB of memory. We'll come back to that.
The Hash seems like the most likely candidate. Let's expand that.
The first new block of information gives us a list of "shortest paths" to the "accumulation point", or the point at which all this potentially-leaking data is gathering. There's more to this in the actual application, but I'm showing the top of the "path" here.

At the top of this list, we see the RubyHash object originally reported as a suspect, and a tree of objects that lead to it. In this case, we go from the Hash itself into a ConcurrentHashMap (note that we're hiding nothing here; you can literally browse anything in memory) which in turn is referenced by the "constants" field of a Class. So already we know that this hash is being referenced in some class's constant table. Pretty cool, eh?
Let's make sure we've got the right Hash and not some harmless data structure inside Rails. If we scroll down a bit more, we see a listing of all the objects this Hash has accumulated. Let's see what's in there.

Ok, so it's a hashtable structure with a table of entries. Can we get more out of this?
Of course like most of these tools, just about everything is clickable. We can dive into one of the hash entries and see what's in there. Clicking on an entry gives us several new ways to display the downstream objects we've managed to aggregate. In this case, we'll just do "List Objects", and the suboption "With Outgoing References" for downstream data.

Now finally in the resulting view of this particular RubyHashEntry, we can see that our MyData object is happily tucked away inside.

Ok, so we definitely have the right data structure. Not only that, but we can see that the entry's "key" is a Time object (org.jruby.RubyTime). Let's go back to the "Shortest Paths" view and examine the ConcurrentHashMap entry that's holding this Hash object. Each entry in this hash maps a constant name to a value, so we should be able to see which constant is holding the leaking references.
(At this point you'll see the side effects of my switch to OpenJDK 7; the memory addresses have changed, but the structure is the same.)

We'll do another "List Objects" "with outgoing references" against the the HashEntry object immediately referencing our RubyHash.

And there it is! In the "key" field of the HashEntry, we see our constant name "LEAKING_ARRAY".
What About That Module?
Oh yeah, what about that Module that showed up in the leak suspects? It was responsible for almost 4MB of the heap. Let's go back and check it out.

A-ha! Eclipse MAT has flagged the Gem module as being a potential leak suspect. But why? Let's go back to the suspect report and look at the Accumulated Objects by Class table, toward the bottom.

Ok, so the Gem module eventually references nearly
Evan Phoenix pointed out that I misread the columns. It's actually 249 Specification objects, their "self" size is almost 6000 bytes, and their "retained" size is 3.8MB. But that gives me an opportunity to show off another feature of MAT: Customized Retained Set calculation.
In this case, the retained size seems a bit suspect. Could there really be 3.8MB of data kept alive by Gem::Specification objects? It seems like a bit much, to be sure, but digging through the tree of references from the Gem module down shows there's several references to classes and modules, which in turn reference constant tables, method tables, and so on. How can we filter out that extra noise?
First we'll return to the view of the Gem module (two screenshots up) by going back to leak suspect #2, expanding "Shortest Paths". The topmost RubyModule in that list is the Gem module, so we're all set to calculate a Customized Retained Set.

The resulting dialog provides a list of options through which you can specify classes or fields to ignore when calculating the retained set from a given starting point. In this case, it's simple enough to filter out org.jruby.RubyClass and org.jruby.RubyModule, so that references from Gem::Specification back into the class/module hierarchy don't get included in calculations.

Which results in a similar view to those we've seen, but with objects sorted by retained heap.

Well what the heck? It looks like it's all String data?
JRuby's String implementation is an org.jruby.RubyString object, aggregating an org.jruby.util.ByteList object, aggregating a byte array, so the top three entries there in total are essentially all String memory. The best way to investigate where they're coming from is to do "List Objects" on RubyString, but instead of "with outgoing references" we'll use "with incoming references" to show where all those Strings are coming from.

Finally we have a view that lets us hunt through all these strings and see where they're coming from. Poking at the first few shows they're stored in constant tables of the Gem module (that last RubyModule I haven't expanded in). That's probably not a big deal. But if we sort the the list of RubyString objects by their retained sizes, we get a different picture of the system.

If we dig into the *largest* String objects, they appear to be referenced by Gem::Specification instance variables! So there's probably something worth investigating here.
It's also worth noting that any Ruby application is going to have a lot of Strings in it, so this isn't all that unusual to see. But it's nice to have a tool that lets you investigate potential inefficiencies (even down to the raw bytes!), and it's nice to know that at least some of that retained data for the Gem module is "real" and not just references back into the class hierarchy.
(And I'm not convinced all those Strings really *need* to be alive...but you're welcome to take it from here!)
Your Turn
Eclipse MAT is probably one of the nicest of the free tools. In addition to object browsing, leak detection, GC root analysis, and object query language support, there's a ton of other features, both in the main distribution and available from third parties. If you're hunting for memory leaks, or just want to investigate the memory usage of your (J)Ruby application, MAT is a tool worth playing with (and as always, I hope you will blog and report your experiences!)
Written on July 12, 2010